The newly declared “war” in Israel adds to global economic uncertainty. The human tragedy is, of course, horrific, and we are saddened by it. There are, however, unknown economic implications, not only around the military responses, but also involving fiscal responses and the implication for major oil producers. It’s too early to draw any conclusions, but, for sure, there will be economic impacts.
Rates
While the Headline Non-Farm Payroll (NFP) number looked strong, a more detailed analysis of the jobs market says otherwise (see below). Unfortunately, this Fed does not appear to delve into the details; it just looks at the headlines. The markets know this, and, as a result, interest rate volatility has been significant, especially over the past two weeks.
The 10-year Treasury ended September at a 4.57% level. A week later (Friday October 6), it spiked to 4.80% as FOMC member speeches continued to be hawkish. But during this past week (ending Friday, October 13), those speeches became significantly more dovish, some even saying that rate hikes are over. The result was a retracement of yields on the 10-year back to near the end of September, as yields on Friday (October 13) closed at 4.61%. Certainly, more volatility lies ahead as Wall Street is not of one mind as far as interest rate forecasts are concerned.
CPI and PPI
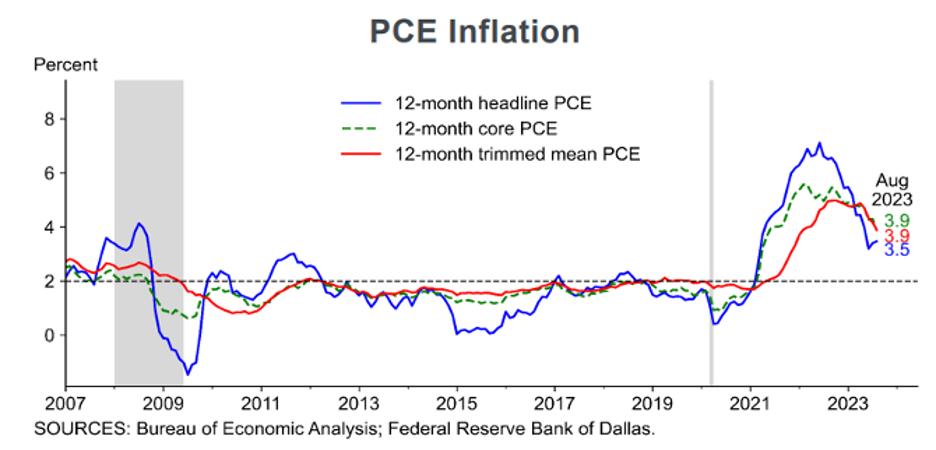
The chart at the top of this blog shows the downtrends now apparent in the Personal Consumption Expenditure (PCE) Price Indexes. And, while Thursday’s monthly Consumer Price Index (CPI) report (+0.4% month/month) disappointed, it was an improvement over August (+0.6%), and the closely watched year/year inflation rate remained at +3.7% in September, same as August. “Core” inflation (less food and energy) came in as anticipated at +0.3% month/month and at +4.1% on a 12-month look back. That number was +4.3% in August. This is the lowest the “Core” has been since October 2021! Unfortunately, the index variant that the Fed watches closely, Core Services less Rents, came in hot at +0.6% month/month in September. Thankfully, the year/year calculation fell to +3.8% in September from +4.0% in August.
Surprisingly, Wall Street’s odds of a November rate hike fell to +8.3%. These odds were +41% in mid-September. The low odds are most likely due to those “dovish” FOMC speeches referenced above. It appears that the FOMC is now adopting the position that, since monetary policy acts with long lags (and in this cycle, the lags look like they are longer than history would suggest), policymakers should wait for the impacts of the existing tightening actions to appear. This, in our view, is going to be the official line at the Fed’s November meetings.
Wednesday’s Producer Price Index (PPI) also came in hot at +0.5% (the consensus estimate was +0.3%). Core PPI (ex-food and energy) showed up at +0.3% (consensus: +0.2%). Those economists who predicted that the next leg down for inflation will be the most difficult appear to have been prescient. But our view is that September’s inflation data will prove to be an aberration, as strong disinflationary forces are still at play.
Once again, we ran some simulations where we assumed three different monthly inflation rates and calculated where the 12-month rate would end up at this year’s end, in mid-2024, and at 12/31/24. The table shows the results.
Given the weakening economy, our view is that the 0.2% column is most likely, but we wouldn’t be surprised if the 12/31/24 outcome showed even lower inflation.
Employment
September Non-Farm Payrolls (NFP), announced on Friday, October 6, were also hot at +336K (Seasonally Adjusted). In addition, July and August were marked up a total of +119K. This could weigh heavily on the FOMC’s November rate hike decision. By the time of their meeting, they will have the October payroll numbers too; that data is likely to be pivotal.
Our view is that, given Challenger’s rapidly rising layoff data, September’s NFP will prove to be an outlier. Here’s why:
- Challenger, Gray and Christmas closely follow layoffs. In their September report, layoffs were up +58% on a year/year basis. September layoffs in the Retail Space (14,958) were the highest in the history of the series. For comparison, the average September layoff rate in the Retail Space is 4,432.
- The auto strike is now producing layoffs in that industry.
- The ADP report on Wednesday, October 4, at +89K was unexpectedly weak. The consensus estimate for ADP was +150K with the low-high estimate range at +102K to +228K. Clearly, ADP’s was a weak report. Let’s not forget that ADP is America’s largest payroll processor, so their data has credibility.
- BLS’s NFP report is a survey of large businesses. Of that +336K NFP number, +96K was the Birth/Death model add-on for small businesses. Our view is that it is highly unlikely that small businesses were expanding their payrolls at a time when retail sales have stagnated.
- The sister survey, the Household Survey (HS), is a phone survey of 60,000 households. That survey occurs simultaneously with the NFP Survey. The HS showed employment growth of only +86K, a similar number to ADP and miles away from the NFP number.
- It is also noteworthy here to remember that BLS counts full-time and part-time jobs equally (we believe that part-time should be counted as half).
- In the HS, full-time jobs fell by -22K. Part-time jobs, therefore, expanded at +108K. If part-time jobs were counted as half, as we believe they should be, the net HS number would have been +32K!
- According to Rosenberg Research, if the HS were adjusted to the same definitions as the NFP Survey uses, the HS would have shown up as -7K.
- Employment in the head-hunting business continues to slip, down -4K in September and down -111K since February. When the head-hunting businesses collapses, it is a sign that the job market is weak, or at least weakening. And while this isn’t yet apparent in the U3 or U6 unemployment rates (3.8% and 7.0% respectively), we think it soon will be.
Economic Gauges – Rents
Rents comprise 35% of headline CPI and 44% of Core CPI. The Apartment List Index is a reliable indicator of the state of the rental market, as its data is taken monthly and is current. The chart shows the Apartment List Rent Index (purple) and the BLS calculation that went into August’s CPI (blue) line. The Apartment List Rent Index peaked near the end of 2021, BLS’s in early 2023, i.e., more than a 12-month lag. As a result, we know that falling rents are built into the next 12 months of CPI.
The next chart shows the number of the U.S.’s 100 largest cities with negative rents by month. Note the steep climb in 2023.
In addition, there is a record number of apartments under construction, more than at any time since 1970. Think of what that’s going to do to an already problematic vacancy rate and to rents.
Housing
The housing market is a major diver of the U.S. economy. New Housing Starts are off more than -11% from a year ago; New Home Sales are down -8.7%, Existing Home Sales are off -0.7%, and Mortgage Loan Applications continue in the doldrums. (Not a wonder with 30-year fixed rate mortgages at 7.8%!)
Loans and Delinquencies
This month, student loan payment recommences after a three year hiatus. The average payment is $400/month and there are over 40 million borrowers. (Average debt is $37.8K and aggregate outstanding balances are more than $1.7 trillion.) That’s $16 billion/month that is no longer available for consumption.
Loan delinquencies are now back to pandemic levels. Note in the chart how low delinquencies were during the fiscal giveaways in 2020 and 2021.
In addition, those that are unable to meet their minimum monthly payments has ratcheted up.
Credit card charge-offs have now spiked to near pandemic levels. We expect them to continue upward and far surpass what occurred in the pandemic period.
In a survey conducted at the end of September, both Economic Optimism
OP
Both Manufacturing and Non-Manufacturing Purchasing Managers’ Indexes are way off their peaks with the Manufacturing Index now in contraction.
On the wage front, the wage-price spiral that has been putting fear into the FOMC, has simply not developed. Wage growth is actually decelerating (left chart) and will likely end the year below 4%. The chart on the right shows that Core Inflation is on the wane. Wages grew 0.2% in September, same as in August. If October shows up as similar, the three-month trend will be a 2.4% annual rate, down from 4.4% in August and >5% at last year’s end. The Fed’s fear of a developing “wage-price spiral” (like that of the 1970s) has been avoided.
Inflation and Price Levels
We have discussed inflation in every issue of this blog for at least the past two years. Of late, we noted in several recent editions that the rate of inflation is falling. Some of our readers have commented that they continue to see price increases in the everyday things they purchase. “Prices are high and rising” they’ve told us. So, let us clarify:
- Inflation is a condition where prices are rising. Say the original price index was 100 and in the ensuing year, inflation is +10%. The price index would have risen to 110 by year’s end. Now say the following year inflation falls to +3.0%. The price index at the end of that year will be 113.3. Note that while inflation fell from +10% to +3%, prices still rose. But they rose at a slower rate in the second year than they did in the first year.
- For prices to stabilize, inflation has to fall to 0%!
- Unfortunately, that isn’t what people actually want. They want prices to go back to where they were in the past, say in 2020 or 2021. If that were to happen, we would be having a bout of “deflation.”
- Deflation is rare (because the government constantly overspends, and the Fed prints the money for them to do so). While rare, deflation sometimes happens in a Recession (Depression) if it is long enough and deep enough. It is our belief that we could see some mild deflation in the oncoming Recession, especially if the unemployment rate rises to the 4.5% level that the Fed is apparently targeting.
- Nonetheless, there is scant chance that price levels will return to their 2020 or 2021 levels. It would be a blessing if they just stopped rising!
Final Thoughts
- While the CPI came in somewhat “hot” in September, the evidence we see says this was an aberration. We expect to see disinflation for the foreseeable future.
- While the headline employment number was a shocker to the upside, the detail tells us that a characterization of “strength” is a misleading one. We expect the employment data to be soft going forward.
- Interest rates have been exceptionally volatile of late. That tells us that market players are not of one mind. The FOMC members, via their public pronouncements, no longer appear to have the same mindset. Hence the market’s confusion. An FOMC member with a hawkish measure causes upside volatility in rates, while those with a more dovish view produce the opposite. Our view is that the Fed is now on “pause” and the next move will be down. That, we think, will occur before mid-2024.
(Joshua Barone and Eugene Hoover contributed to this blog)
Read the full article here


