Continuing my series of updates on dividend-focused exchange-traded funds, today I would like to review the VictoryShares Dividend Accelerator ETF (NASDAQ:VSDA), which I previously covered in October 2023. Back then, I maintained the neutral stance that I had taken in my first note on this dividend-growth-centered vehicle published in May 2022, mostly owing to VSDA’s value characteristics that were not to my liking, even though there was close to nothing to criticize about its quality and something to appreciate regarding dividend growth.
Today, I would like to focus on the changes in VSDA’s factor mix, which have been rather substantial as around a quarter of its portfolio has been replaced since the previous coverage. I would also like to comment on VSDA’s returns and answer the question whether I see alpha potential in it.
What is the basis for VSDA’s strategy?
As we know from its website, the Nasdaq Victory Dividend Accelerator Index has been the basis for VSDA’s strategy since its inception in April 2017. The prospectus offers a glimpse into the index methodology. It is explained that the Nasdaq US Large Mid Cap Index is the selection universe. The idea is
to identify dividend paying stocks with a higher likelihood of future dividend growth.
As we know from the fact sheet, to whittle the list down to the 75 worthiest names, the following parameters are assessed:
- dividend growth, namely “a minimum of five consecutive years of increasing dividends and a higher probability of future dividend growth,”
- Return on Equity,
- earnings stability.
Reconstitutions follow an annual schedule, while rebalancing is more frequent, with adjustments made every quarter.
VSDA performance: outpacing a few peers but lagging the market
My concerns regarding VSDA’s valuation potentially detracting from its performance were a little overblown, as the significance of the value factor has been diminishing since October as investors have switched their attention to the return of the dovish monetary policy that they have been expecting amid progress on suppressing inflation. So the ETF has risen substantially since my October note, mirroring the market-wide recovery. However, VSDA has still significantly underperformed the S&P 500 index, which I attribute to its rather soft growth profile (i.e., comparatively small weighted-average forward revenue and earnings growth rates).
Seeking Alpha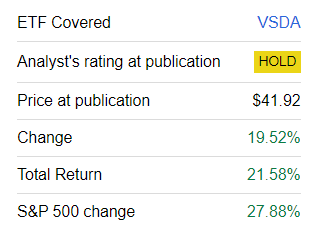
Over longer periods, VSDA was also incapable of beating the market consistently (represented by the iShares Core S&P 500 ETF (IVV) in the table below), even though it trounced a few peers like the ProShares S&P 500 Dividend Aristocrats ETF (NOBL) and the ProShares S&P MidCap 400 Dividend Aristocrats ETF (REGL). In the meantime, both the iShares Core Dividend Growth ETF (DGRO) and the Vanguard Dividend Appreciation Fund ETF Shares (VIG) did significantly better.
| Metric | VSDA | REGL | VIG | NOBL | DGRO | IVV |
| Start Balance | $10,000 | $10,000 | $10,000 | $10,000 | $10,000 | $10,000 |
| End Balance | $22,507 | $18,461 | $23,830 | $20,687 | $23,308 | $26,225 |
| CAGR | 11.84% | 8.82% | 12.72% | 10.55% | 12.38% | 14.22% |
| Standard Deviation | 15.79% | 16.18% | 14.89% | 16.17% | 15.58% | 16.71% |
| Best Year | 31.39% | 20.38% | 29.62% | 27.39% | 29.87% | 31.25% |
| Worst Year | -4.41% | -3.26% | -9.81% | -6.51% | -7.90% | -18.16% |
| Maximum Drawdown | -19.07% | -24.53% | -20.19% | -23.23% | -21.92% | -23.93% |
| Sharpe Ratio | 0.66 | 0.48 | 0.74 | 0.57 | 0.7 | 0.76 |
| Sortino Ratio | 1.03 | 0.72 | 1.17 | 0.87 | 1.08 | 1.16 |
| Benchmark Correlation | 0.92 | 0.85 | 0.96 | 0.92 | 0.95 | 1 |
| Upside Capture | 85.29% | 72.06% | 84.87% | 83.58% | 87.93% | 100% |
| Downside Capture | 89.56% | 83.46% | 85.74% | 91.86% | 90.32% | 100% |
Data from Portfolio Visualizer. The period is May 2017–July 2024. The ETFs were benchmarked against IVV
VSDA factor mix: solid quality, yet insufficient growth exposure
As of August 1, VSDA had 74 equities in its portfolio, with the overlap with the October version being only about 75%. The fund has welcomed numerous newcomers, chief among them being Bristol-Myers Squibb Company (BMY) and T. Rowe Price Group (TROW), sporting 2.49% and 2.32% weight, respectively. In the meantime, multiple stocks have failed to demonstrate characteristics VSDA’s underlying index favors, so they were jettisoned as a consequence. A few examples worth mentioning are Flowers Foods (FLO), 3M (MMM), and Apple (AAPL).
| Stock | Weight as of October 23, 2023 |
| FLO | 3.35% |
| MMM | 3.29% |
| AAPL | 2.94% |
Data from the ETF
The heaviest position is Altria (MO), a high-yield consumer staples sector bellwether with a 3.9% weight. It is interesting to see MO making it to the top spot because, as of the previous analysis, it was only in 66th place. Overall, the said sector is the one VSDA is currently enamored of, as can be deduced from the fact that the fund allocated 26.4% of its net assets to it while ignoring real estate and communication.
Calculated by the author using data from Seeking Alpha and the ETF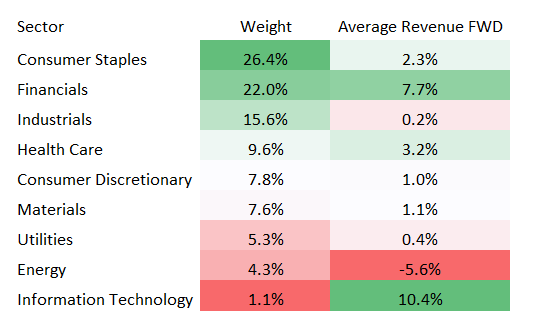
Such substantial exposure adds a touch of defensiveness to VSDA’s portfolio, making its dividend yield a bit more durable and recession-resistant (which looks more relevant today as the soft jobs report has allowed recession fears to resurface), but what comes as an inevitable side effect is rather mediocre growth exposure that I believe can detract from its performance in the near term. To corroborate, below are weighted-average growth rates I calculated using data from Seeking Alpha and VSDA. They look hardly competitive, especially assuming IVV has both of these metrics in double digits.
| Portfolio as of | EPS Fwd | Revenue Fwd |
| October 2023 | 4.1% | 3.9% |
| August 2024 | 5.3% | 2.2% |
I should also add here that this does not chime in well with the fact that VSDA favors stocks with “the highest probability of future dividend growth,” as soft top- and bottom-line growth makes it much more complicated for companies to reward shareholders more generously.
When it comes to value, we see that VSDA is still heavy in mega-caps, with a weighted-average market cap of $108.8 billion as of August 1, in contrast to $173.3 billion as of October 24, mostly owing to the removal of AAPL. The weighted-average adjusted earnings yield (no negative figures were taken into account) is at 5.2%, which gives it an edge over IVV, which has an EY of about 3.8%. Besides, VSDA’s has allocated about 22% to stocks with a B- Quant Valuation grade or higher; the tech-heavy IVV has invested just about 8% in such stocks.
Regarding quality, it is complicated to identify a significant vulnerability in this mix. Close to 93% of the holdings have a B- Quant Profitability rating or stronger, while the adjusted Return on Equity is around 19% (negative and triple-digit figures were removed from the data). This is fairly close to IVV’s 19.7%. The Return on Assets is comparatively strong at 8.9%.
Speaking about earnings quality, an important ingredient of dividend sustainability, I suppose it is worth adding here that outside the financial sector, close to 65% of VSDA’s holdings delivered an at least 1x Net CFFO/Net income ratio in the last twelve months, indicating their accounting profit was backed by the net operating cash flows. This is a decent result.
Regarding the dividend characteristics of VSDA’s portfolio, in my previous note, I wrote that this ETF “has a mostly solid dividend growth story under the hood.” This statement still holds some merit. However, it is worth understanding that these rates are decent but not spectacular, as shown below:
| Portfolio as of | Div Growth 3Y | Div Growth 5Y |
| October 2023 | 6.9% | 7.9% |
| August 2024 | 7.5% | 7.5% |
Calculated by author using data from Seeking Alpha and the ETF
For context, IVV, which has significant exposure to companies that do not pay a dividend (around 16%), has a weighted-average 5-year dividend CAGR of 6.8%.
And also, a 2.7% weighted-average DY of the VSDA portfolio is not particularly attractive, especially assuming this vehicle has an expense ratio of 35 bps. At this juncture, the ETF itself is yielding 2.07%.
Final thoughts
VSDA offers a somewhat sophisticated take on dividend-growth investing, which I, in fairness, like. It is wise to screen stocks not only for promising dividend growth track records but also for earnings stability and capital efficiency (assessed via ROE, not the most reliable metric, yet much better than ignoring that factor like many other dividend ETFs do). And as I discussed above, the resulting equity mix has only minor vulnerabilities. So here, VSDA has obviously succeeded. What I do not like, though, is its inadequate growth exposure. I am not particularly impressed by its low- and mid-single-digit weighted-average growth rates. In this regard, I do not see alpha potential in this vehicle, and it is best to maintain the Hold rating.
Read the full article here