
Introduction
We last covered iShares Expanded Tech Sector ETF (NYSEARCA:IGM) in September 2023. At that time, despite the fact that we liked its long-term outlook, we felt its valuation was expensive and preferred to buy during a dip for a higher margin of safety. It has been about 10 months since we last covered IGM, we think it is time for us to provide another update.
ETF Overview
IGM invests in a portfolio of about 280 U.S. technology stocks. The fund has outperformed the broader market since the cyclical low reached in October 2022. IGM is expected to benefit from strong earnings growth rates of the technology sector in the next few years. However, its valuation is very expensive. Only a few other subsectors such as application software, and interactive media & services within the technology space still have closer to fair valuations. Therefore, we think investors may want to consider other funds that have higher exposure to these subsectors instead.
Fund Analysis
Strong rally since our last coverage
Despite the fact that we think it was expensive when we last analyzed IGM in September 2023, the fund delivered very strong performance, delivering a total return of 48.1% thanks to the market’s hype on artificial intelligence. This return was much better than the S&P 500 index’s 26.1% in the same period. Since the broader market reached its cyclical low in October 2022, IGM has delivered a total return of 117.9%, almost doubled the total return of 61.1% of the S&P 500 index. As can be seen from the chart below, there were no meaningful pullbacks or corrections since October 2022.
YCharts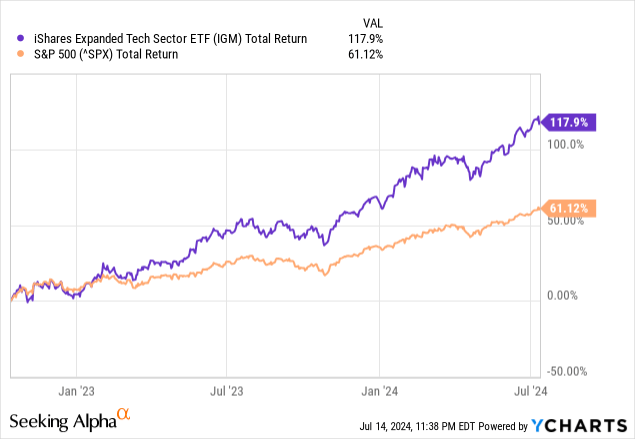
IGM’s fundamental: heavily tilted towards growth
Technology sector is a fast-growing sector relative to other sectors. Below is a chart that shows the consensus EPS growth rates among different sectors in the S&P 500 index. As the chart below shows, information technology sector is expected to grow at annual EPS growth rates of 28.1% and 23.2% in 2024 and 2025, respectively. These growth rates are significantly better than most other sectors and much better than the broader index. For reader’s information, stocks in the S&P 500 index are only expected to grow at annual EPS growth rates of 12.1% and 15.4%, respectively. Since IGM only focuses on technology stocks, it is likely that IGM will continue to outperform the S&P 500 index in the next few years.
MacroMicro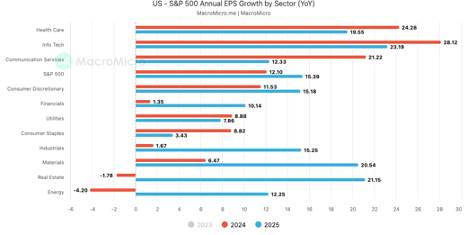
Valuation becomes even more expensive
In our previous article on IGM, we noted that the average forward P/E ratio of information technology stocks in the S&P 500 was about 27x. It was quite high, as the average forward P/E ratio in the past 20 years was about 20x. The valuation in September 2023 was already near the peak reached in late 2021. The strong performance of the broader technology sector in the past year has pushed this valuation even higher. As can be seen from the chart below, the forward P/E ratio of technology stocks in the S&P 500 index is now over 30x, surpassing the peak reached in late 2021. Although we have not yet reached the record over 40x that was set during the dot com bubble in 2000, we are moving towards that direction unless there is a significant pullback. We understand the future of our society will be forever transformed by the artificial intelligence and GPTs, but if the valuation continues to expand, the bubble will likely become even bigger.
Yardeni Research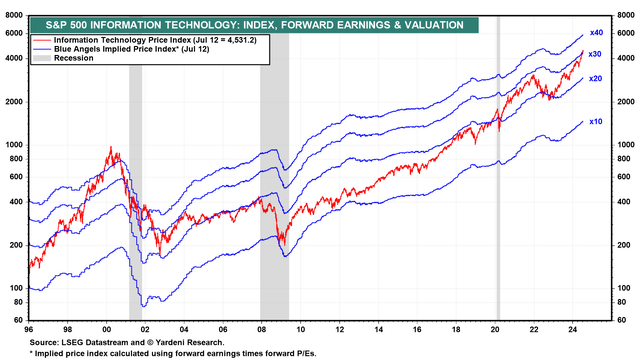
Let us look at the valuation of IGM’s main subsectors. As can be seen from the chart below, IGM’s top 4 subsectors include: semiconductors (24.7%), interactive media & services (17.3%), systems software (14.1%), and application software (13.0%).
iShares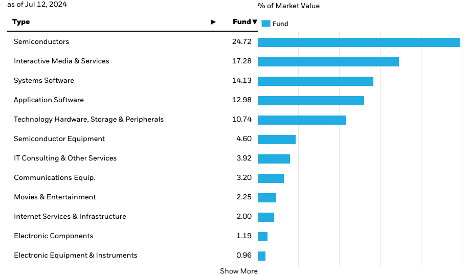
IGM’s top subsector, semiconductors, is very expensive. As can be seen from the chart below, the forward P/E ratio of semiconductor stocks in the S&P 500 index is currently at 34.1x. This is much higher than the average range of about 18-20x in the past 2 decades, and much higher than the peak reached in late 2021.
Yardeni Research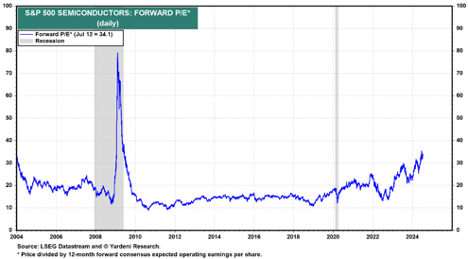
IGM’s second largest subsector, interactive media & services, still has a reasonable valuation. As can be seen from the chart below, the forward P/E ratio of these stocks in the S&P 500 index is only 23.7x. This is still below their peak of above 30x reached since 2020 and has only started to reach the valuation level before the pandemic in 2019.
Yardeni Research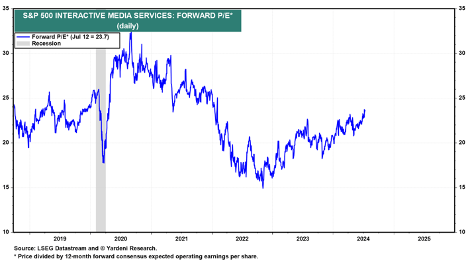
IGM’s third largest subsector, system software, is rich in valuation. As can be seen from the chart below, the average forward P/E ratio of these system software stocks in the S&P 500 index has reached 34.4x. This valuation is certainly much higher than the cyclical low of about 21x reached in October 2022, and is also significantly higher than the average in the past 20 years.
Yardeni Research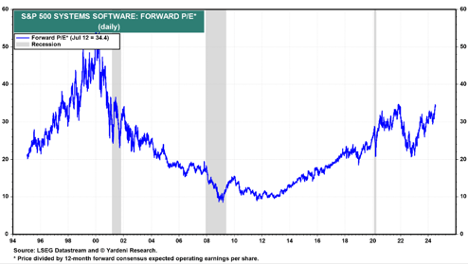
Finally, IGM’s fourth largest subsector, application software, is not expensive relative to other sectors. The average forward P/E ratio of these stocks in the S&P 500 index is only about 30.9x. This is still much lower than the above 50x valuation reached during the pandemic.
Yardeni Research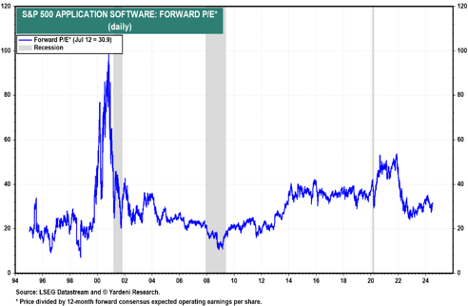
Investor Takeaway
Based on our analysis, the broader technology space is expensive and hence there is significant downside risk if the broader market decides it is time to pull back. Our analysis indicates that there are still areas in the technology space that are not expensive, such as application software and interactive media & services subsectors. Therefore, we think it may be better to seek other funds that have higher exposure to these less expensive subsectors instead. For example, iShares Expanded Tech-Software Sector ETF (IGV) has a 63% exposure to application software subsector. We hope to analyze IGV and provide our recommendations on this fund very soon.
Read the full article here